Previous
Monitor machine status
You can configure triggers that alert you when machine telemetry data syncs from your local device to the Viam cloud:
For example, you can configure a trigger to send you a notification when your machine’s CPU usage reaches a certain threshold.
Additionally, you can receive continuous alerts at a specified interval indicating one of the following machine statuses:
The following steps show you how to configure sbc-hwmonitor sensors to monitor different metrics about a machine, such as:
memory_monitor: Memory stats for the SBC.cpu_monitor: Reports per-core and overall usage percentages.temperature: Reports the temperature of various temperature sensors.The following steps show you how to configure telegraf sensors to monitor different metrics about a machine, such as:
mem: Memory stats for the SBC.cpu: Reports per-core and overall usage percentages.Add the performance metrics sensors
On your machine’s CONFIGURE page, click the + icon next to your machine part in the left-hand menu and select Component or service.
Search for and add the hwmonitor:cpu_monitor model provided by the sbc-hwmonitor.
(Optional) Customize the sensor configuration
Add additional sensors for any other metrics you want to track.
You can find a list of sensors on the sbc-hwmonitor module page.
Test the sensor
Click Save to put your configuration changes into effect.
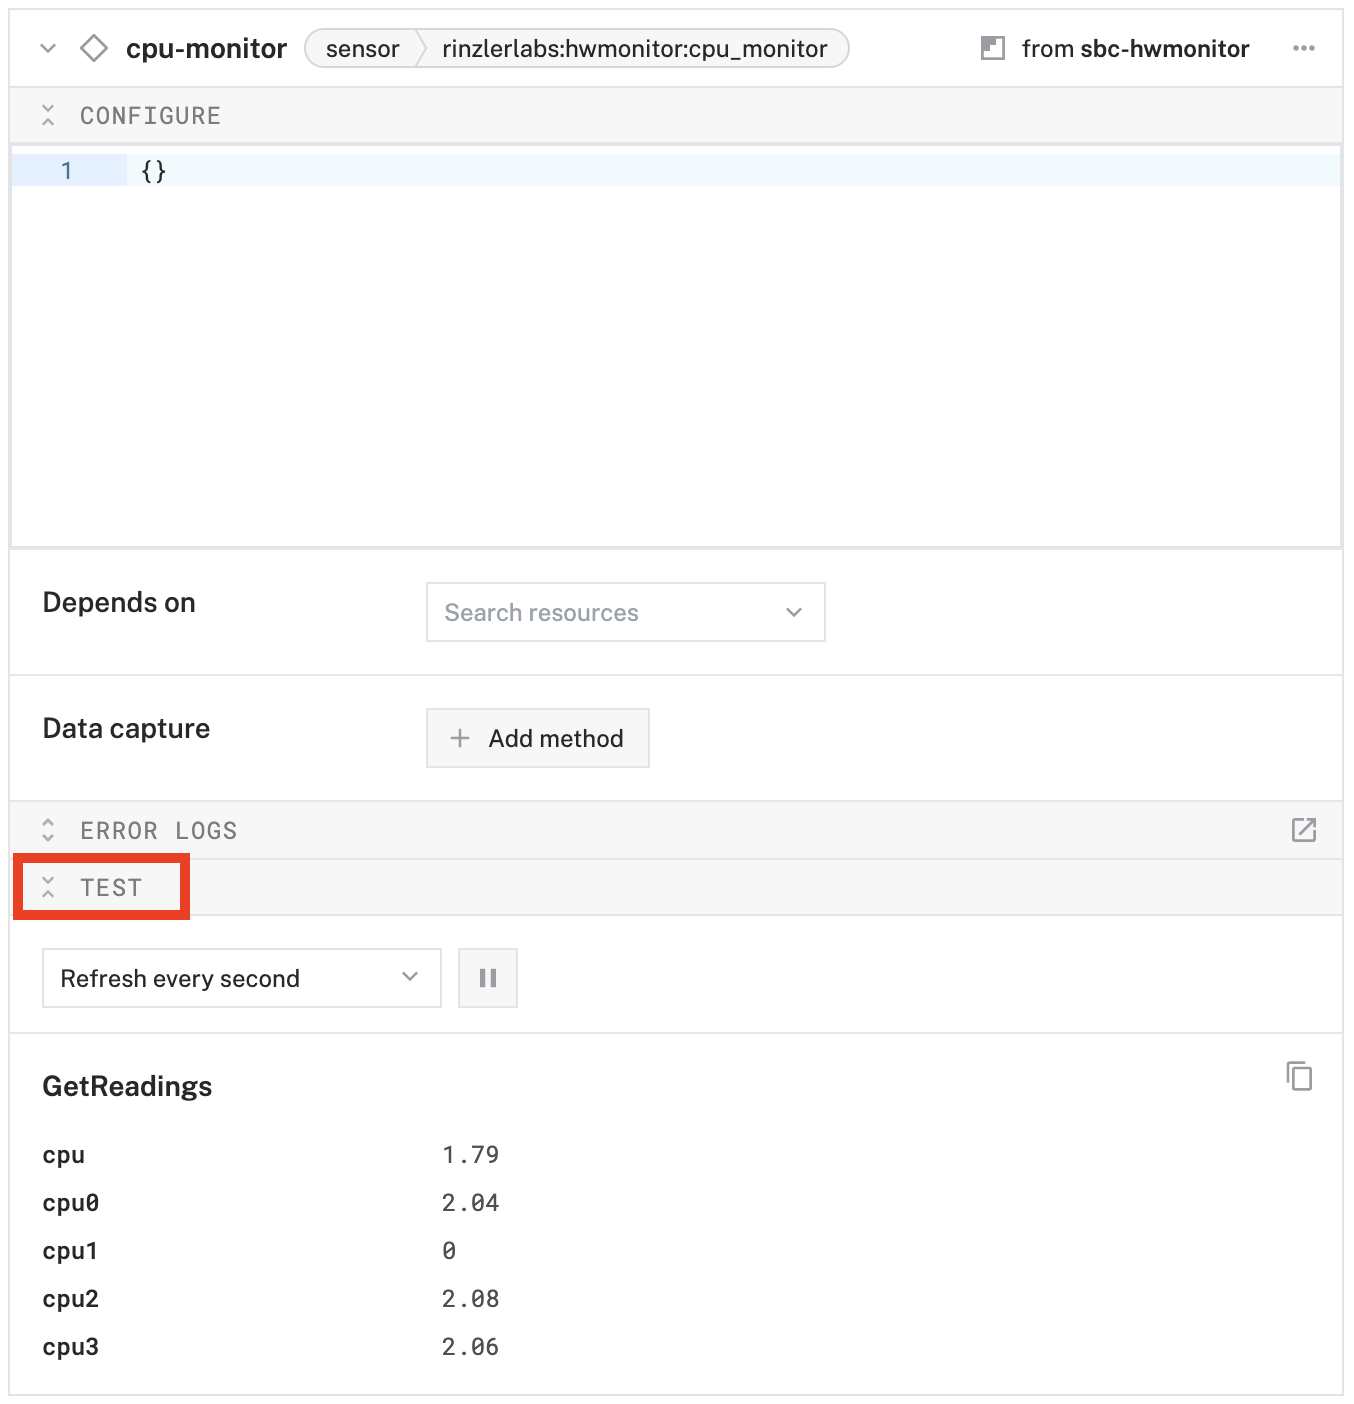
Now, click Test at the bottom of the sensor configuration card to view the readings. You can also see readings on the CONTROL tab.
Add the performance metrics sensors
On your machine’s CONFIGURE page, click the + icon next to your machine part in the left-hand menu and select Component.
Search for and add the viam-sensor:telegrafsensor model.
(Optional) Customize the sensor configuration
Add additional sensors for any other metrics you want to track.
You can find a list of sensors on the viam-telegraf-sensor module page.
Test the sensor
Click Save to apply your configuration changes.
Now, click Test at the bottom of the sensor configuration card to view the readings. You can also see readings on the CONTROL tab.

To capture or alert on the data from your configured sensor, you must add the data management service and configure it to capture and sync the sensor data:
Add the data management service
On your machine’s CONFIGURE page, click the + icon next to your machine part in the left-hand menu and select Component or service.
Select the data management / RDK service and click Create.
You can leave the default data sync interval of 0.1 minutes to sync every 6 seconds.
Also leave both Capturing and Syncing toggles in the “on” position.
Configure data capture on the sensor
Return to your sensor’s configuration card.
In the Data capture section, click Add method.
From the Method dropdown select Readings.
Set the Frequency to 0.05 Hz to capture readings once every 20 seconds.

Click the Save button to apply your configuration changes.
View synced data
Click the … menu in the upper-right corner of the sensor configuration card. Select View captured data. If you do not immediately see data, wait a minute for the data to be captured and synced at the intervals you specified, then refresh the page.

Use Builder mode to create a trigger:
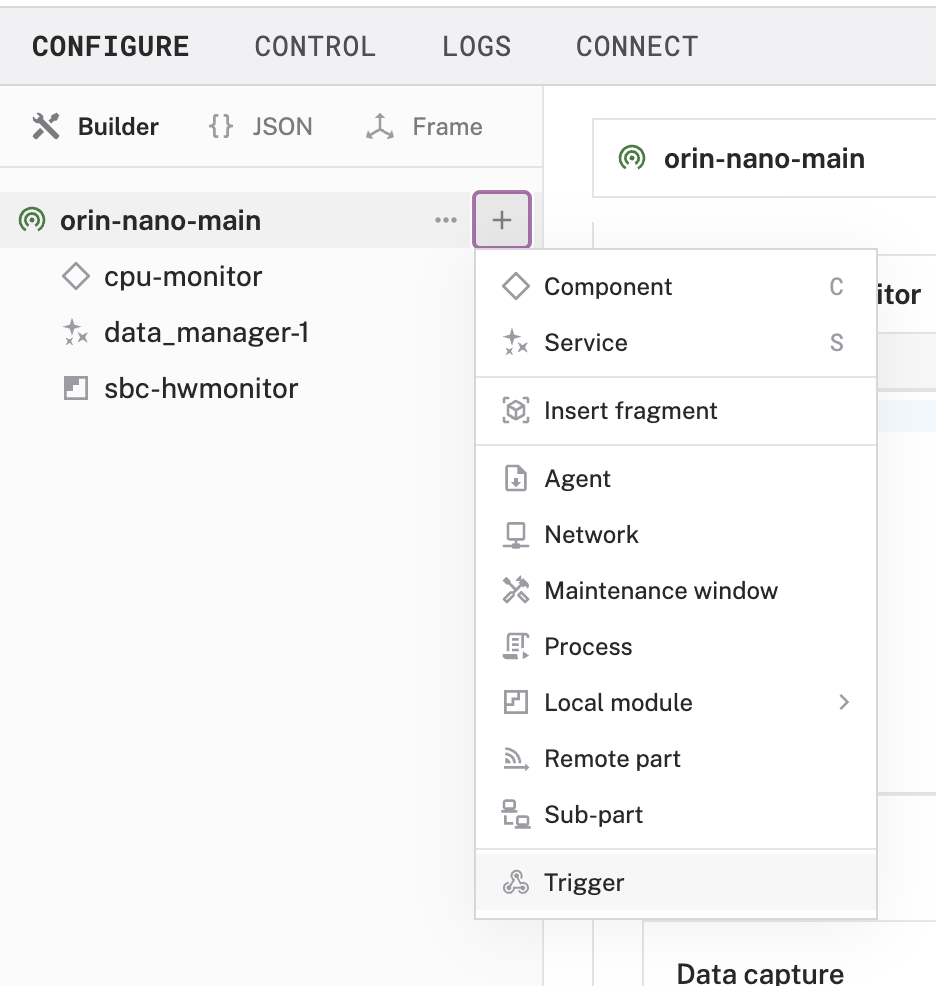
Go to the CONFIGURE tab of your machine on the Viam app. Click the + (Create) button in the left side menu and select Trigger.
Create the trigger
Enter a name and click Create.
Configure type
In the Type dropdown, choose one of the following types:
Data has been synced to the cloud: Whenever your machine syncs data of any of the specified data types, the trigger sends an alert.
To use this trigger type, select the data types for which the trigger should send requests.
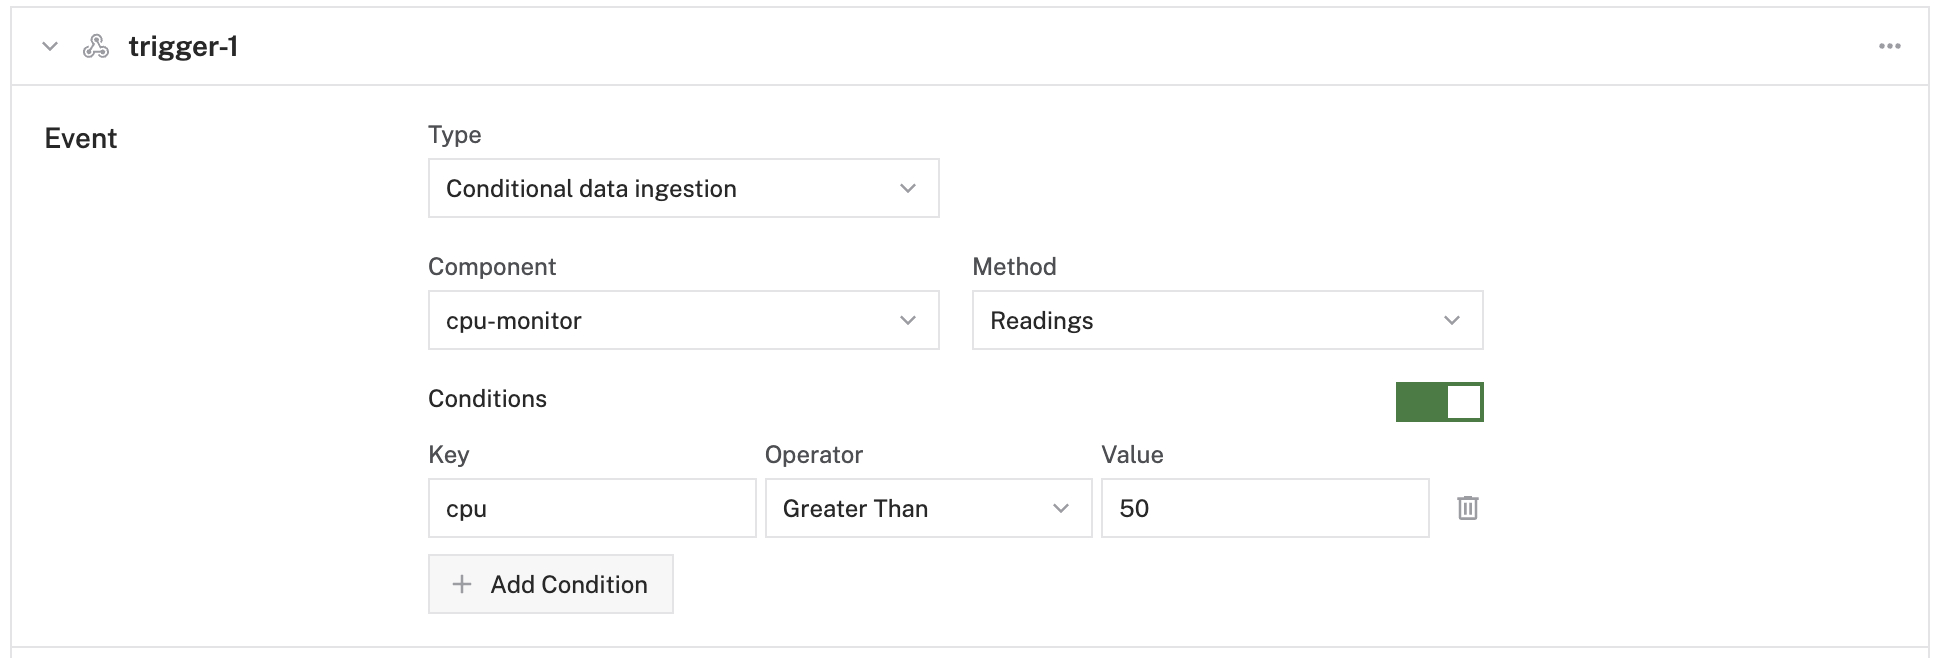
Conditional data ingestion: Whenever your machine syncs data that meets certain criteria, the trigger sends an alert.
To use this trigger type:
Choose the target component and method for your condition.
Add a condition: specify a key in the synced data, an operator, and a value. When data from the target component and method syncs from your machine, the trigger uses the key as a path to look up a value in the synced data object. The trigger applies the operator to the extracted value and the value you specified in your condition.
For example, the following trigger sends an alert when the cpu-monitor component’s Readings method syncs cpu usage greater than 50:
For more information, see Conditional attributes.
Configure alert frequency
To add a notification method, add an entry to the Webhooks or Email sub-panels:
To add an email notification:
Click Add Email.
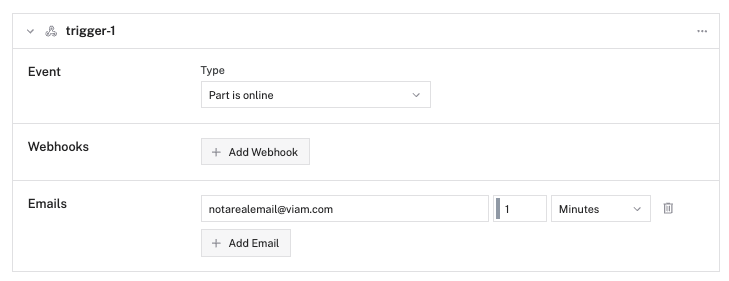
Add the email you wish to be notified whenever this trigger is triggered.
Configure the time between notifications.
To add a webhook notification:
Click Add Webhook.
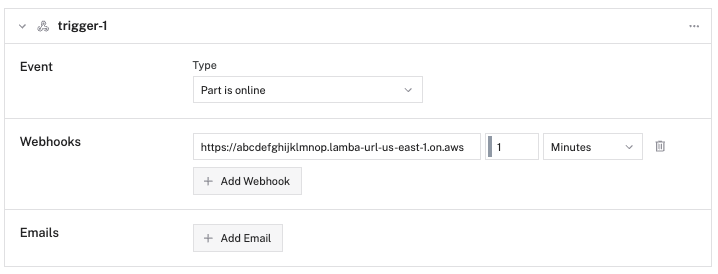
Add the URL of your cloud function.
Configure the time between notifications.
Write your cloud function to process the webhook. Use your cloud function to process data or interact with any external API, including Twilio, PagerDuty, or Zapier.
Use the following template in your components JSON to configure the top-level triggers field:
"triggers": [
  {
    "name": "trigger-1",
    "event": {
      "type": "part_data_ingested",
      "data_ingested": {
        "data_types": ["binary", "tabular", "file", "unspecified"]
      }
    },
    "notifications": [
      {
        "type": "<webhook|email>",
        "value": "<webhook URL or email address>",
        "seconds_between_notifications": <int>
      }
    ]
  }
]
"triggers": [
  {
    "name": "<trigger name>",
    "event": {
      "type": "conditional_data_ingested",
      "conditional": {
        "data_capture_method": "<component>:<name-of-component>:<method>",
        "conditions": {
          "evals": [
            {
              "operator": "<lt|gt|lte|gte|eq|neq|regex>",
              "value": <object, string, bool, regex, or int>
            }
          ]
        }
      }
    },
    "notifications": [
      {
        "type": "<webhook|email>",
        "value": "<webhook URL or email address>",
        "seconds_between_notifications": <number of seconds>
      }
    ]
  }
]
For more information about triggers, see Trigger configuration.
If this is a test project, make sure you stop data capture to avoid charges for syncing unwanted data.
In the Data capture section of your sensor’s configuration, toggle the switch to Off.
Click the Save button in the top right corner of the page to save your configuration.
Go to the CONFIGURE tab of your machine on the Viam app. Click the + (Create) button in the left side menu and select Trigger.

Name the trigger and click Create.
Select Part is online as the trigger Type.
To add a notification method, add an entry to the Webhooks or Email sub-panels:
To add an email notification:
Click Add Email.

Add the email you wish to be notified whenever this trigger is triggered.
Configure the time between notifications.
To add a webhook notification:
Click Add Webhook.

Add the URL of your cloud function.
Configure the time between notifications.
Write your cloud function to process the webhook attributes. Use your cloud function to process data or interact with any external API, including Twilio, PagerDuty, or Zapier.
Use the following template in your components JSON to configure the top-level triggers field:
"triggers": [
  {
    "name": "<trigger name>",
    "event": {
      "type": "part_online"
    },
    "notifications": [
      {
        "type": "<webhook|email>",
        "value": "<webhook URL or email address>",
        "seconds_between_notifications": <number of seconds>
      }
    ]
  }
]
For more information about triggers, see Trigger configuration.
Go to the CONFIGURE tab of your machine on the Viam app. Click the + (Create) button in the left side menu and select Trigger.

Name the trigger and click Create.
Select Part is offline as the trigger Type.
Add Webhooks or Emails and configure the time between notifications. For more information on webhooks, see Webhook attributes.
Use the following template in your components JSON to configure the top-level triggers field:
"triggers": [
  {
    "name": "<trigger name>",
    "event": {
      "type": "part_offline"
    },
     "notifications": [
      {
        "type": "webhook|email",
        "value": "<webhook URL or email address>",
        "seconds_between_notifications": <number of seconds>
      }
     ]
  }
]
For more information about triggers, see Trigger configuration.
Was this page helpful?
Glad to hear it! If you have any other feedback please let us know:
We're sorry about that. To help us improve, please tell us what we can do better:
Thank you!